Know how you compare in digital? We do.

We rank, score and analyse the digital experience of every brand in your category. See where you win, where you fail, and what to do about it.

Green tilted dashboard showing a pie chart, a line graph, a bar chart, and list icons with an arrow looping upward on the left.Pink rectangular score card with the word SCORE, a circular progress bar mostly filled in red, and the number 78 in white at the center, with a red arrow curving downward to the right.Pink card with a red circular progress bar indicating a score of 78 and a red arrow pointing downward.
Page titled 'Chapter 1: The True Cost of Standing Still' stating 'The comfortable middle is about to get way less comfortable.' It discusses how brands challenging norms means 'good enough' is no longer an option, with statistics about Australian car buyers' digital experience and preferences for online car retailers.

Find your rank, fast

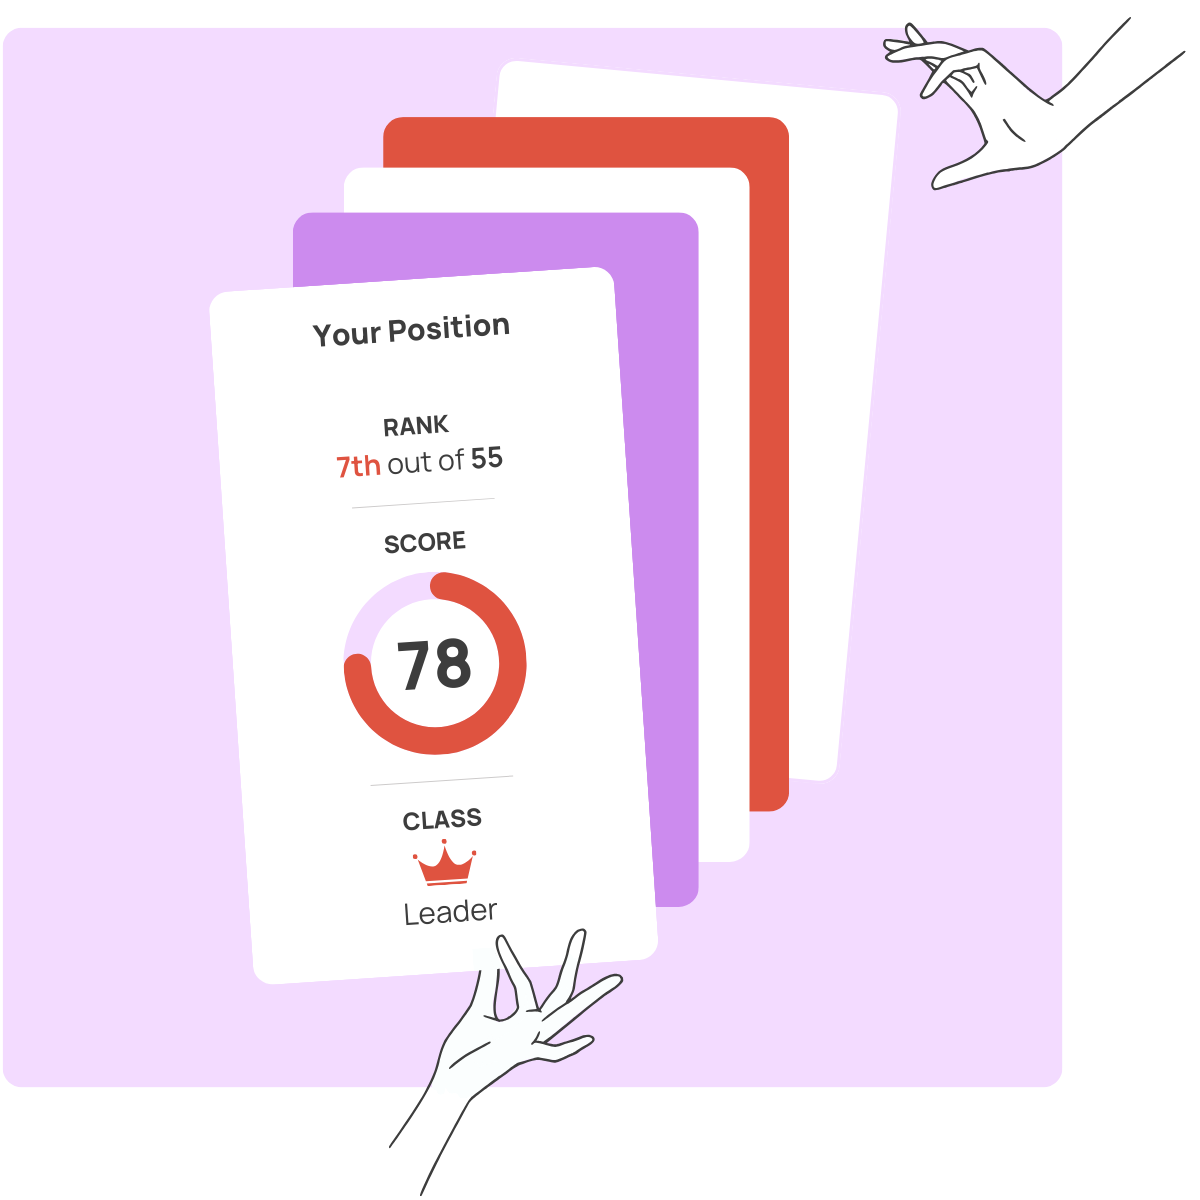
We gather 110+ data points from expert reviews, third-party data and technical tests for every brand in your category, magic them into a single score, and rank you all. Brutal, right? But you’ll know exactly where you stand.

Discover your real digital priorities

Data without a way forward? Gross. We’d never do that to you. Our insights and implications are written by career strategists who’ll outline exactly where you lag and what you can do about it.

Grid of twelve square icons with thumbs-up in green squares and thumbs-down in purple squares, surrounded by circular progress indicators, with two illustrated hands interacting with the squares.
Silhouette map of Australia including the island of Tasmania.

Made in Australia by Aussie digital experts

Meet founders
Text discussing challenges in balancing immersion and product information with a radar chart showing category performance across criteria like brand experience and features.

Benchmark everything

Without context, data is meaningless. Deep, huh, AND true. Compare your brand to leaders and category norms across almost any part of your digital experience.

Deep context on tap

We serve up best practice 24/7. Metrics and case studies on your competitors? Right away, madam. Deep dives and trends to support a new feature design? Why of course.

Illustration of white hands interacting with various stylized reports and charts in green and purple on a light green background.

Let us Marie-Kondo the $#*% out of your digital planning process. We’ll help you focus on the right data points to build stronger business cases, benchmark better, design faster and boost your category position.

Something for everyone

Purple outline of a briefcase centered on a green circular background.

C-Suite & executives

See exactly where you sit in the category digitally and how to boost your position.
Make more informed decisions
Uncover clearer targets
Get the big picture for digital in your category fast
Get access

Digital & marketing managers

Everything you need to prioritise and plan your efforts in digital based on evidence.
Unbiased insights you can trust
Build better business cases
Expand your digital knowledge quickly with deep dives
Get access

Design, dev & UX teams

Keep tabs on your competitors in digital, and get evidence and inspo for your next project.
Create evidence-based roadmaps
Set more realistic targets
Get better examples with Australian-specific case studies
Get access

BI advisors & analysts

Put your metrics in context, and get smarter targets based on real category benchmarks.
Build more meaningful reports
Pick better benchmarks
Use our criteria-based framework to strengthen your reporting
Get access